
Home › Video & Performance Analysis
Player tracking: optical and wearable data
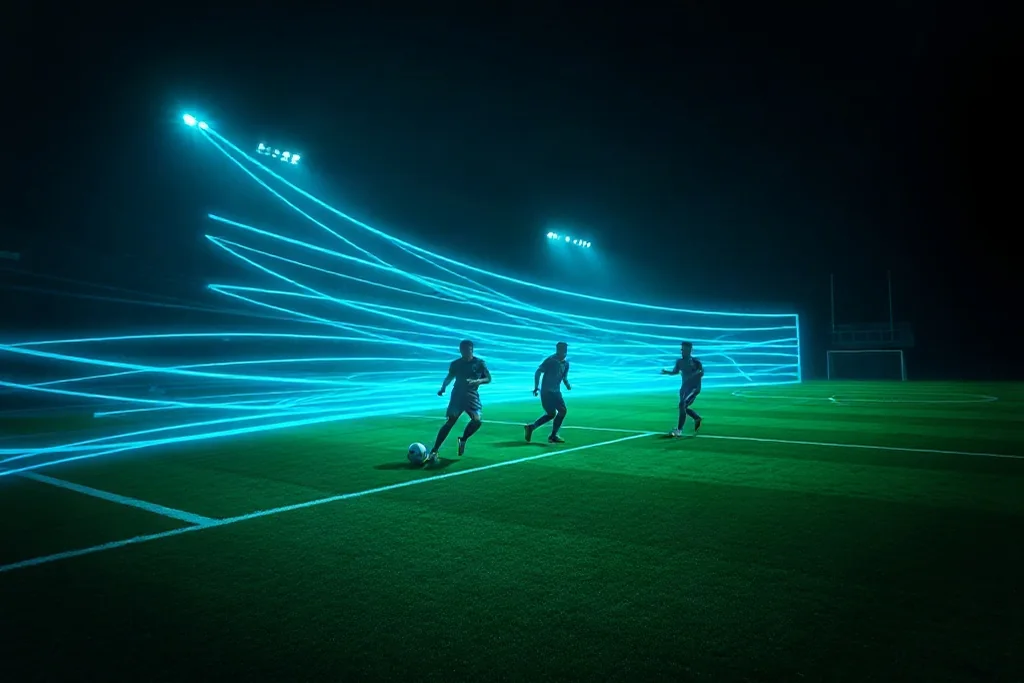
Every player on the pitch moves, and every movement can be recorded. Player tracking turns those movements into data: a stream of positions, updated many times a second, for every player and the ball. It is the raw material behind distance covered, sprint counts, positional heat maps and much of modern tactical analysis.
This guide explains how tracking data is collected, the difference between optical and wearable systems, what each can measure and how sampling rate shapes what the data is capable of describing.
Optical tracking from cameras
Optical systems use several cameras positioned around the stadium. Each camera records the pitch, and software identifies the players and the ball in every frame, then converts those positions into coordinates. Because nothing is worn, optical tracking records both teams and the referee without any equipment on the players.
The strength of optical tracking is coverage. It captures everyone on the pitch at once, in the same coordinate system, which is what makes it suitable for analysing team shape, spacing and the interaction between the two sides. Its challenge is accuracy when players are crowded or occluded.
Wearable devices and sensors
Wearable systems place a device on the player, usually a small unit in a vest between the shoulder blades. The device computes position and motion from satellite signals and internal sensors, and it can also record acceleration, heart rate and other physiological signals that cameras cannot see.
Wearables excel at individual workload monitoring, which is why they are common in training. Their limitation is positional precision relative to optical systems, and the fact that they record only the players wearing them — usually one team at a time.
Sampling rate and what it enables
Tracking systems record positions at a set frequency, measured in samples per second. The sampling rate decides what the data can describe. A higher rate captures sharp accelerations, decelerations and direction changes accurately; a lower rate smooths those movements out and can miss the very actions that distinguish a sprint from a jog.
This is why workload metrics depend on sampling quality. Counting sprints requires seeing the acceleration that defines a sprint, and measuring change of direction requires enough samples along the curve. The number of samples per second is therefore a capability statement about the data, not a technical footnote.
From positions to football insight
Raw positions become useful once they are aggregated. Distance covered, sprint counts, average positions, positional compactness and the space occupied by each team are all derived from the same coordinate stream. Combined with event data, tracking adds the context that events alone lack: where every player was when the pass was played.
The honest reading keeps the limits in view. Tracking sees movement, not intent, and it records physical output without medical context. It is a powerful description of what happened on the pitch, and it never explains why without a human interpreting it.
What tracking systems measure
Optical and wearable systems between them produce a wide family of derived metrics.
- Position of every player, sampled many times per second.
- Distance covered, in total and by speed band.
- Sprint counts and high-intensity running.
- Acceleration and deceleration events.
- Team compactness and the space between the lines.
- Workload and physiological signals, where wearable.
Optical and wearable tracking compared
The two collection methods trade coverage against physiological detail. The bars indicate relative strength in each dimension.
Choosing between tracking methods
Each method suits a different question and a different setting.
| Dimension | Optical cameras | Wearable sensors |
|---|---|---|
| Coverage | All players and the ball | Only the equipped team |
| Best use | Match and tactical analysis | Training and workload |
| Extra signals | Positions and ball | Heart rate and internal load |
| Main limit | Occlusion in crowded areas | Lower positional precision |
Analysis workflows are only as good as their consistency. A process that changes every week cannot produce comparable evidence, however sophisticated each individual step may be.
The analyst's currency is attention. Every report competes with a coach's time, so the value lies in selecting what matters rather than in exhaustively describing what happened.
Football analysis sits between data and judgement. The data supplies a pattern; the human supplies the context, the priorities and the decision that no dataset can make alone.
Movement is data, meaning is human
Player tracking records where everyone went and how fast they got there, and that is a great deal. What it cannot supply is purpose. The analyst's task is to turn a stream of positions into a statement about football — and to know which parts of that statement the data supports and which parts are interpretation.
Read next
Data-led scouting: a working methodology
How a scouting process combines shortlists, filters and live viewing — and where data must hand over to the eye.
Video analysis: a workflow for coaches
Clipping, tagging and presenting: a repeatable video workflow from raw footage to a team meeting.
How event data is collected and coded
From live coding to automated detection: how pass, shot and defensive events get into a dataset, and why definitions matter.